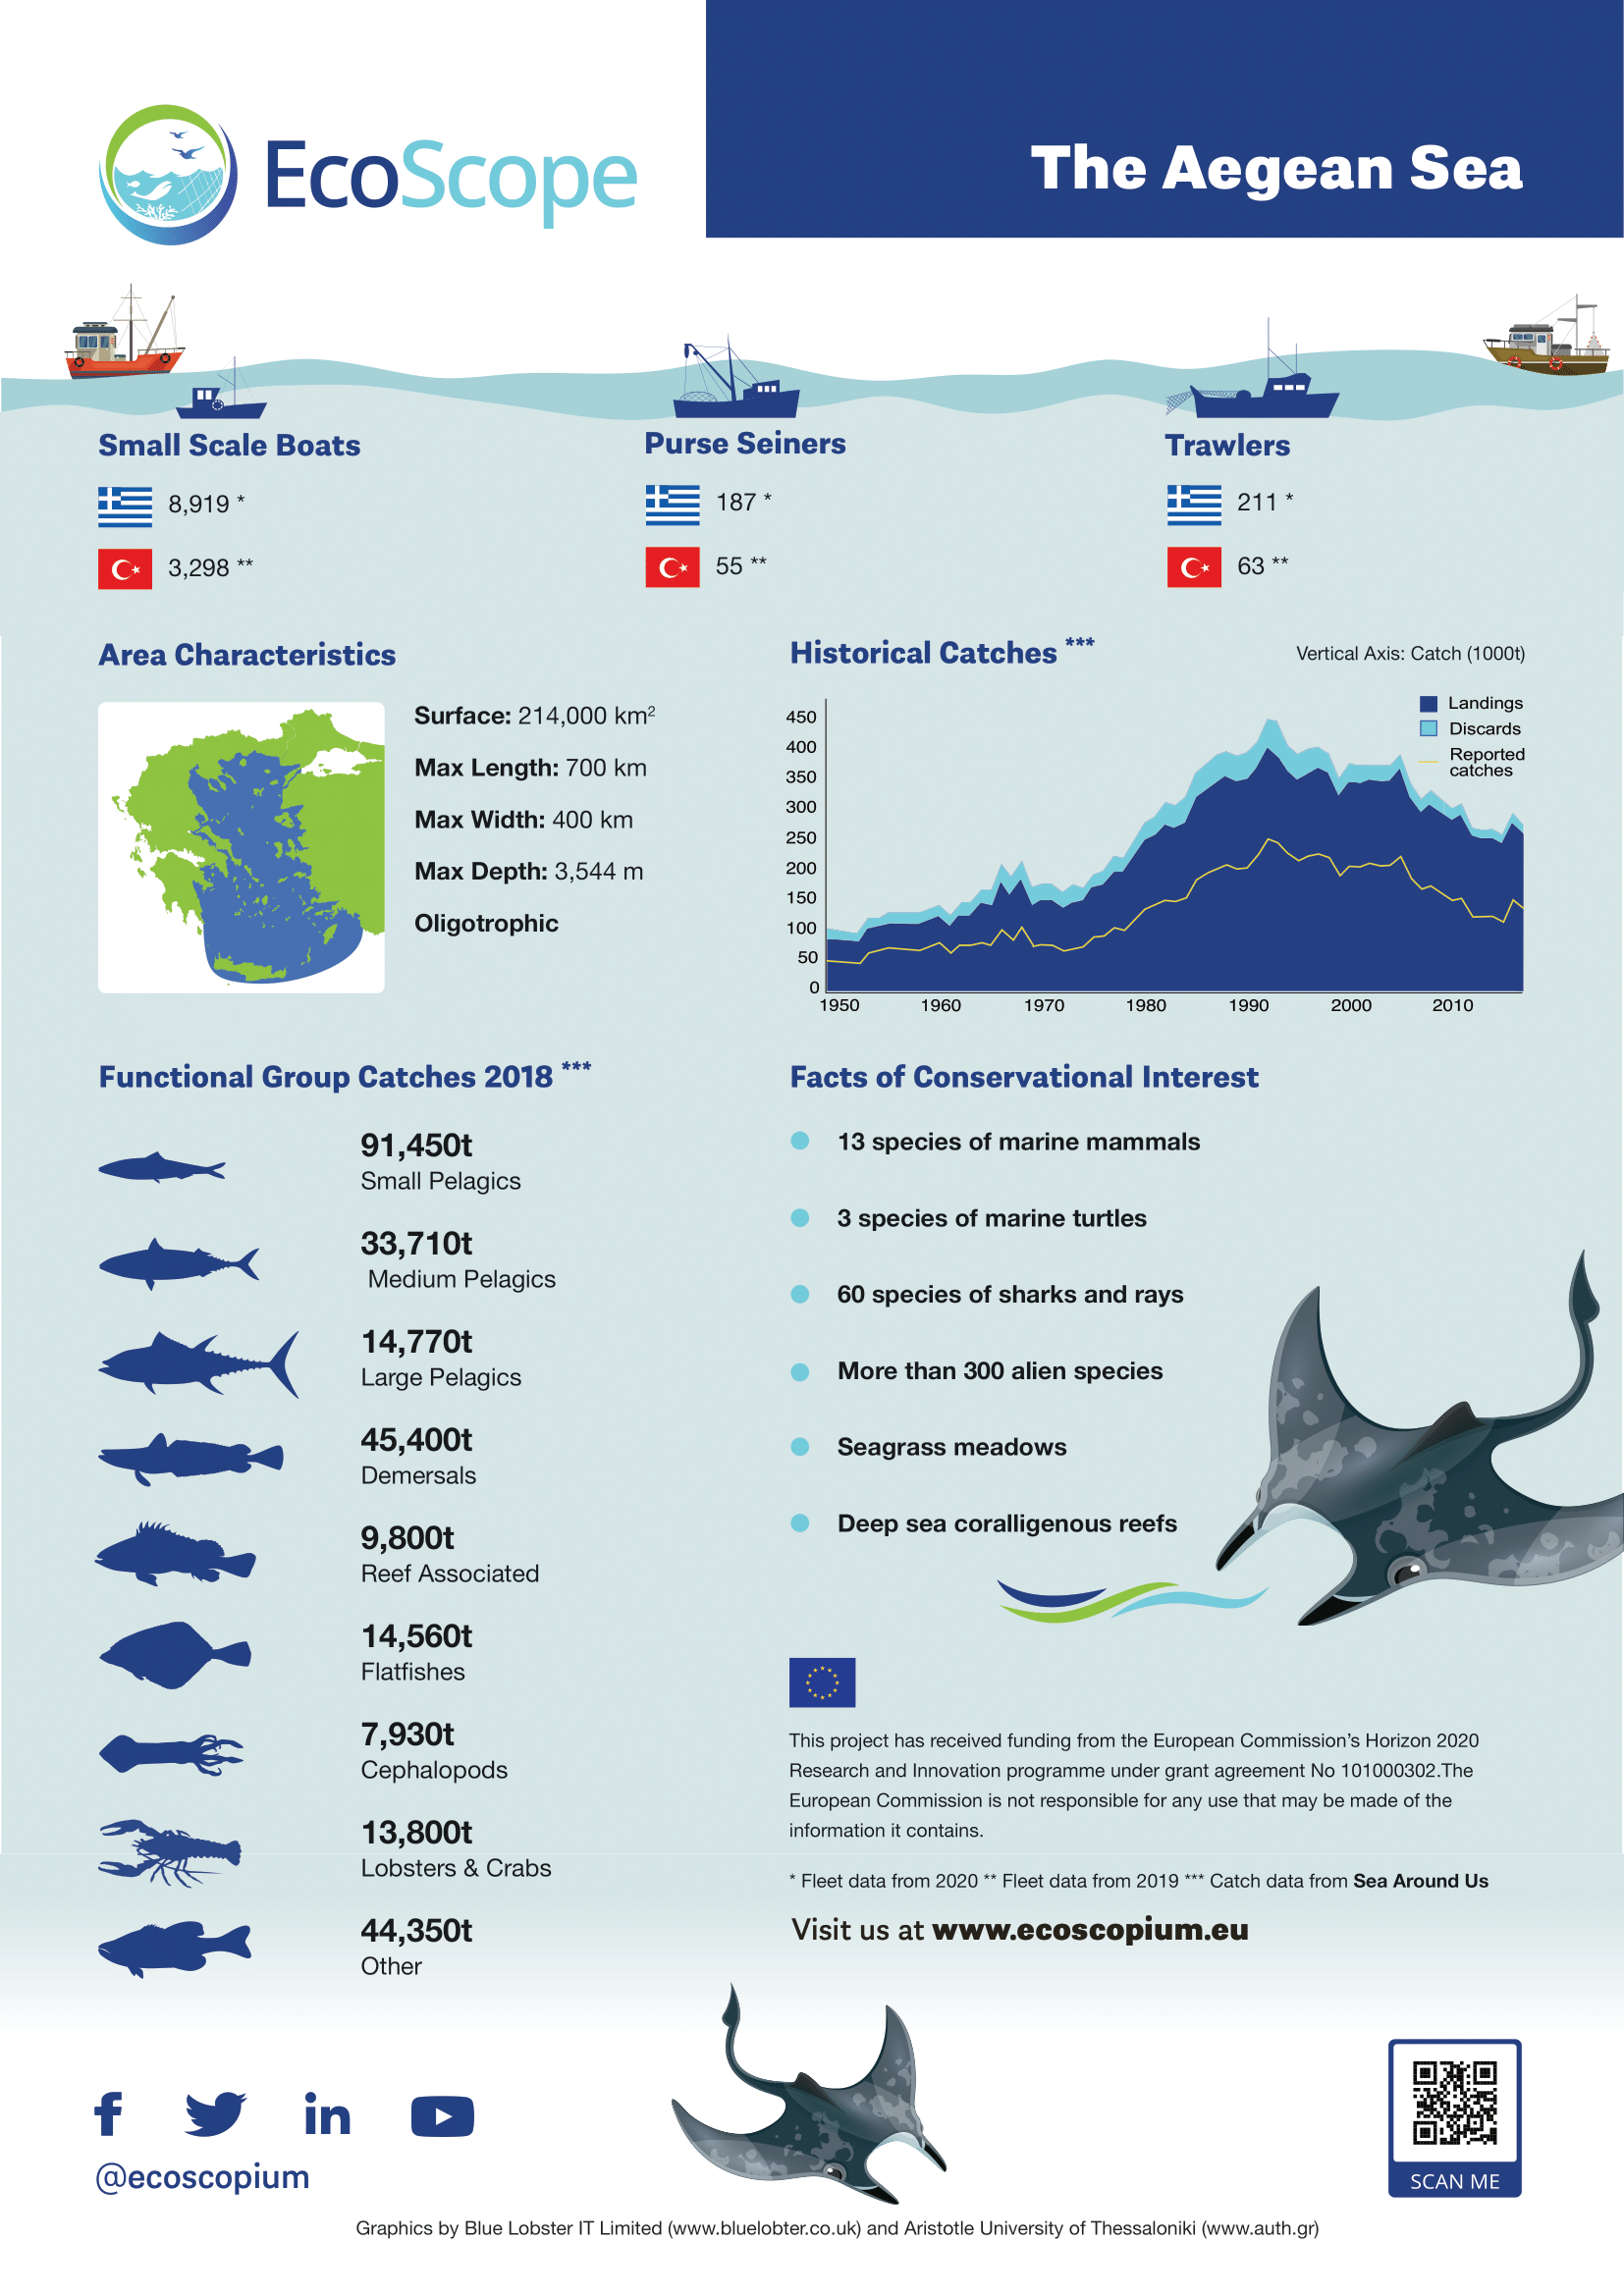
Fisheries Sustainability Scoring Index
year | Catch | F.Fmsy | B.Bmsy | mTLc | FiB | FSI | Ryther | Fogarty | Friedland | ResIndex | MTC | Percent_Direct_Human_Consumption | Percent_Nei | Percent_assessed_biomass |
---|---|---|---|---|---|---|---|---|---|---|---|---|---|---|
1970 | 34461 | 3.38 | 0 | 2.06 | 0.121 | 0.666 | 17.91 | 0.815 | 0.218 | 0.774 | ||||
1971 | 34223 | 3.35 | -0.03 | 1.97 | 0.121 | 0.662 | 17.84 | 0.824 | 0.226 | 0.779 | ||||
1972 | 41446 | 3.34 | 0.05 | 1.77 | 0.146 | 0.652 | 17.93 | 0.826 | 0.212 | 0.777 | ||||
1973 | 46321 | 3.31 | 0.06 | 1.52 | 0.163 | 0.638 | 17.92 | 0.836 | 0.227 | 0.766 | ||||
1974 | 42403 | 3.32 | 0.04 | 1.66 | 0.149 | 0.634 | 17.93 | 0.809 | 0.21 | 0.789 | ||||
1975 | 48378 | 3.28 | 0.05 | 1.39 | 0.17 | 0.633 | 18.1 | 0.871 | 0.232 | 0.753 | ||||
1976 | 57273 | 3.28 | 0.13 | 1.23 | 0.202 | 0.624 | 18.25 | 0.858 | 0.214 | 0.772 | ||||
1977 | 55374 | 3.31 | 0.15 | 1.4 | 0.195 | 0.631 | 18.24 | 0.849 | 0.217 | 0.763 | ||||
1978 | 62932 | 3.32 | 0.21 | 1.31 | 0.222 | 0.617 | 18.29 | 0.82 | 0.208 | 0.778 | ||||
1979 | 70596 | 3.25 | 0.19 | 0.92 | 0.249 | 0.61 | 18.04 | 0.828 | 0.185 | 0.808 | ||||
1980 | 72779 | 3.27 | 0.22 | 0.99 | 0.256 | 0.615 | 18.21 | 0.828 | 0.204 | 0.778 | ||||
1981 | 69171 | 3.28 | 0.21 | 1.06 | 0.244 | 0.615 | 18.29 | 0.828 | 0.212 | 0.763 | ||||
1982 | 77416 | 0.679 | 1.365 | 3.25 | 0.22 | 0.86 | 0.273 | 0.622 | 18.44 | 0.833 | 0.135 | 0.827 | ||
1983 | 77201 | 0.714 | 1.395 | 3.24 | 0.21 | 0.83 | 0.272 | 0.615 | 18.54 | 0.808 | 0.15 | 0.813 | ||
1984 | 76150 | 0.642 | 1.392 | 3.23 | 0.19 | 0.79 | 0.268 | 0.605 | 18.62 | 0.805 | 0.143 | 0.814 | ||
1985 | 95957 | 0.682 | 1.341 | 3.26 | 0.33 | 0.73 | 0.338 | 0.604 | 18.65 | 0.782 | 0.124 | 0.833 | ||
1986 | 101757 | 0.775 | 1.308 | 3.2 | 0.29 | 0.41 | 0.358 | 0.604 | 18.68 | 0.809 | 0.137 | 0.815 | ||
1987 | 109338 | 0.795 | 1.275 | 3.1 | 0.22 | -0.07 | 0.385 | 0.606 | 18.66 | 0.811 | 0.142 | 0.82 | ||
1988 | 110092 | 0.822 | 1.207 | 3.02 | 0.14 | -0.39 | 0.388 | 0.606 | 18.73 | 0.806 | 0.168 | 0.779 | ||
1989 | 125010 | 0.942 | 1.142 | 2.91 | 0.09 | -0.93 | 0.44 | 0.606 | 18.5 | 0.799 | 0.161 | 0.797 | ||
1990 | 108309 | 0.942 | 1.08 | 3.04 | 0.14 | -0.28 | 0.381 | 0.596 | 18.67 | 0.826 | 0.194 | 0.759 | ||
1991 | 129764 | 1.076 | 1.064 | 2.96 | 0.14 | -0.77 | 0.457 | 0.617 | 18.53 | 0.786 | 0.207 | 0.755 | ||
1992 | 150249 | 1.307 | 1.009 | 3.01 | 0.26 | -0.67 | 0.529 | 0.606 | 18.28 | 0.784 | 0.175 | 0.792 | ||
1993 | 160980 | 1.365 | 0.928 | 3.13 | 0.41 | -0.29 | 0.567 | 0.597 | 18.64 | 0.784 | 0.143 | 0.823 | ||
1994 | 177206 | 1.528 | 0.84 | 3.25 | 0.58 | 0.12 | 0.624 | 0.612 | 18.75 | 0.779 | 0.144 | 0.819 | ||
1995 | 147871 | 1.603 | 0.799 | 2.97 | 0.22 | -0.87 | 0.521 | 0.598 | 18.46 | 0.77 | 0.155 | 0.81 | ||
1996 | 138319 | 1.534 | 0.701 | 2.9 | 0.12 | -1.08 | 0.487 | 0.604 | 18.59 | 0.805 | 0.17 | 0.777 | ||
1997 | 146121 | 1.499 | 0.655 | 2.66 | -0.09 | -2.1 | 0.515 | 0.606 | 18.44 | 0.79 | 0.18 | 0.77 | ||
1998 | 127440 | 1.366 | 0.694 | 3.02 | 0.21 | -0.54 | 0.449 | 0.6 | 18.3 | 0.8 | 0.174 | 0.788 | ||
1999 | 106646 | 1.202 | 0.656 | 2.69 | -0.2 | -1.71 | 0.376 | 1212888 | 0.59 | 18.55 | 0.787 | 0.224 | 0.713 | |
2000 | 88500 | 1.184 | 0.638 | 3.12 | 0.15 | 0.18 | 0.312 | 1051410 | 0.597 | 18.44 | 0.824 | 0.228 | 0.733 | |
2001 | 84402 | 1.134 | 0.645 | 3.07 | 0.08 | 0.04 | 0.297 | 1084151 | 0.607 | 18.81 | 0.83 | 0.241 | 0.724 | |
2002 | 87101 | 1.09 | 0.618 | 2.97 | 0 | -0.38 | 0.307 | 1060554 | 0.608 | 18.93 | 0.827 | 0.191 | 0.774 | |
2003 | 81994 | 1.224 | 0.615 | 2.89 | -0.11 | -0.65 | 0.289 | 889281 | 0.603 | 19.01 | 0.832 | 0.216 | 0.755 | |
2004 | 89795 | 1.326 | 0.646 | 2.91 | -0.05 | -0.66 | 0.316 | 972387 | 0.61 | 19.14 | 0.821 | 0.21 | 0.761 | |
2005 | 92075 | 1.41 | 0.652 | 3.01 | 0.07 | -0.27 | 0.324 | 1024236 | 0.602 | 18.92 | 0.812 | 0.193 | 0.766 | |
2006 | 109893 | 1.539 | 0.661 | 2.78 | -0.09 | -1.35 | 0.387 | 1104413 | 81095 | 0.596 | 19.01 | 0.786 | 0.15 | 0.815 |
2007 | 107877 | 1.538 | 0.633 | 3.01 | 0.13 | -0.43 | 0.38 | 1217036 | 79375 | 0.6 | 18.84 | 0.79 | 0.132 | 0.838 |
2008 | 90077 | 1.586 | 0.619 | 3.04 | 0.08 | -0.14 | 0.317 | 1009280 | 68796 | 0.605 | 18.91 | 0.797 | 0.135 | 0.827 |
2009 | 100234 | 1.545 | 0.6 | 3.06 | 0.15 | -0.14 | 0.353 | 1159017 | 78270 | 0.602 | 18.85 | 0.775 | 0.114 | 0.847 |
2010 | 82237 | 1.583 | 0.563 | 3 | 0.01 | -0.22 | 0.29 | 859193 | 59908 | 0.604 | 19.06 | 0.775 | 0.146 | 0.814 |
2011 | 71194 | 1.488 | 0.535 | 2.98 | -0.08 | -0.19 | 0.251 | 779121 | 55350 | 0.606 | 19 | 0.747 | 0.136 | 0.836 |
2012 | 71492 | 1.312 | 0.539 | 3.02 | -0.04 | -0.02 | 0.252 | 867383 | 55208 | 0.605 | 18.89 | 0.752 | 0.147 | 0.825 |
2013 | 71021 | 1.21 | 0.526 | 3.01 | -0.05 | -0.05 | 0.25 | 844618 | 57168 | 0.603 | 18.93 | 0.772 | 0.135 | 0.831 |
2014 | 74306 | 1.13 | 0.534 | 2.97 | -0.08 | -0.28 | 0.262 | 951657 | 61622 | 0.614 | 18.93 | 0.799 | 0.123 | 0.836 |
2015 | 80892 | 1.029 | 0.521 | 2.92 | -0.09 | -0.53 | 0.285 | 835645 | 58580 | 0.611 | 19 | 0.798 | 0.11 | 0.851 |
2016 | 87844 | 0.905 | 0.515 | 2.81 | -0.16 | -1.07 | 0.309 | 1067692 | 70721 | 0.625 | 19.17 | 0.795 | 0.108 | 0.823 |
2017 | 102089 | 0.818 | 0.515 | 2.88 | -0.03 | -0.92 | 0.36 | 1212991 | 80047 | 0.621 | 18.93 | 0.78 | 0.107 | 0.837 |
2018 | 97467 | 0.86 | 0.561 | 2.84 | -0.08 | -1.01 | 0.343 | 1099116 | 72308 | 0.623 | 19 | 0.764 | 0.092 | 0.85 |
2019 | 100935 | 0.89 | 0.622 | 2.84 | -0.07 | -1.05 | 0.355 | 1107659 | 74456 | 0.627 | 19.22 | 0.787 | 0.094 | 0.858 |
2020 | 92233 | 0.793 | 0.664 | 2.8 | -0.15 | -1.14 | 0.325 | 1069026 | 75374 | 0.63 | 19.24 | 0.089 | 0.857 |
Individual indicators
Fishing pressure (F/Fmsy)
The current fishing mortality or fishing pressure (F) over the fishing mortality or fishing pressure (FMSY) that, if applied over a time span similar to generation time, will eventually result in a catch equal to MSY.


Stock status (B/Bmsy)
The current biomass/stock size (B) over the smallest stock size that can support catches equal to MSY (BMSY). It is an output of stock assessment models and ideally, in ecosystem perspective, it should include a large proportion of the exploited species.


Mean Weighted Trophic Level of the Catch (mTLc)
The mean weighted trophic level of the catch (mTLc) is calculated based on the trophic level of species weighted by the catch/landings of each species contributing to the total catch. It is used to assess the effect of fisheries on marine communities and ecosystems.


Fishing in Balance index (FiB)
The Fishing in Balance index (FiB), which complements the mTLc, is an indicator of exploitation and geographic/bathymetric expansion or contraction of fisheries.


Fishing Sustainability Index (FSI)
Fishing Sustainability Index (FSI) uses a factor to correct the magnitude of difference of mTLc and FiB to the first year of the time series and expresses this difference in standard deviation units so that the ordinate scale indicates change without reference to absolute trophic levels.


Ryther Index (Ryther Index)
Ryther index expresses the catch/landings per area (in km2).


Fogarty Index (Fogarty Index)
Fogarty index expresses the catch/landings per unit of primary production.


Friedland Index (Friedland Index)
Friedland index expresses the catch/landings per unit of chl-a.


Resilience Index (Res Index)
The Resilience Index (Res Index) is calculated based on the maximum intrinsic population increase (resilience) of species weighted by the catch/landings of each species contributing to the total catch. It is used to assess the effect of fisheries on marine communities and ecosystems.


Mean Temperature of the Catch (MTC)
The mean temperature of the catch (MTC) is an index that is used for the evaluation of the effect of sea warming on marine fisheries based on the preferred temperature range of the species participating in the catch/landings.


Catch/Landings
Total catch or landings per area/fleet which gives historical information on the fisheries and is used in as a preliminary assessment in fisheries management and as input in ecosystem models.


