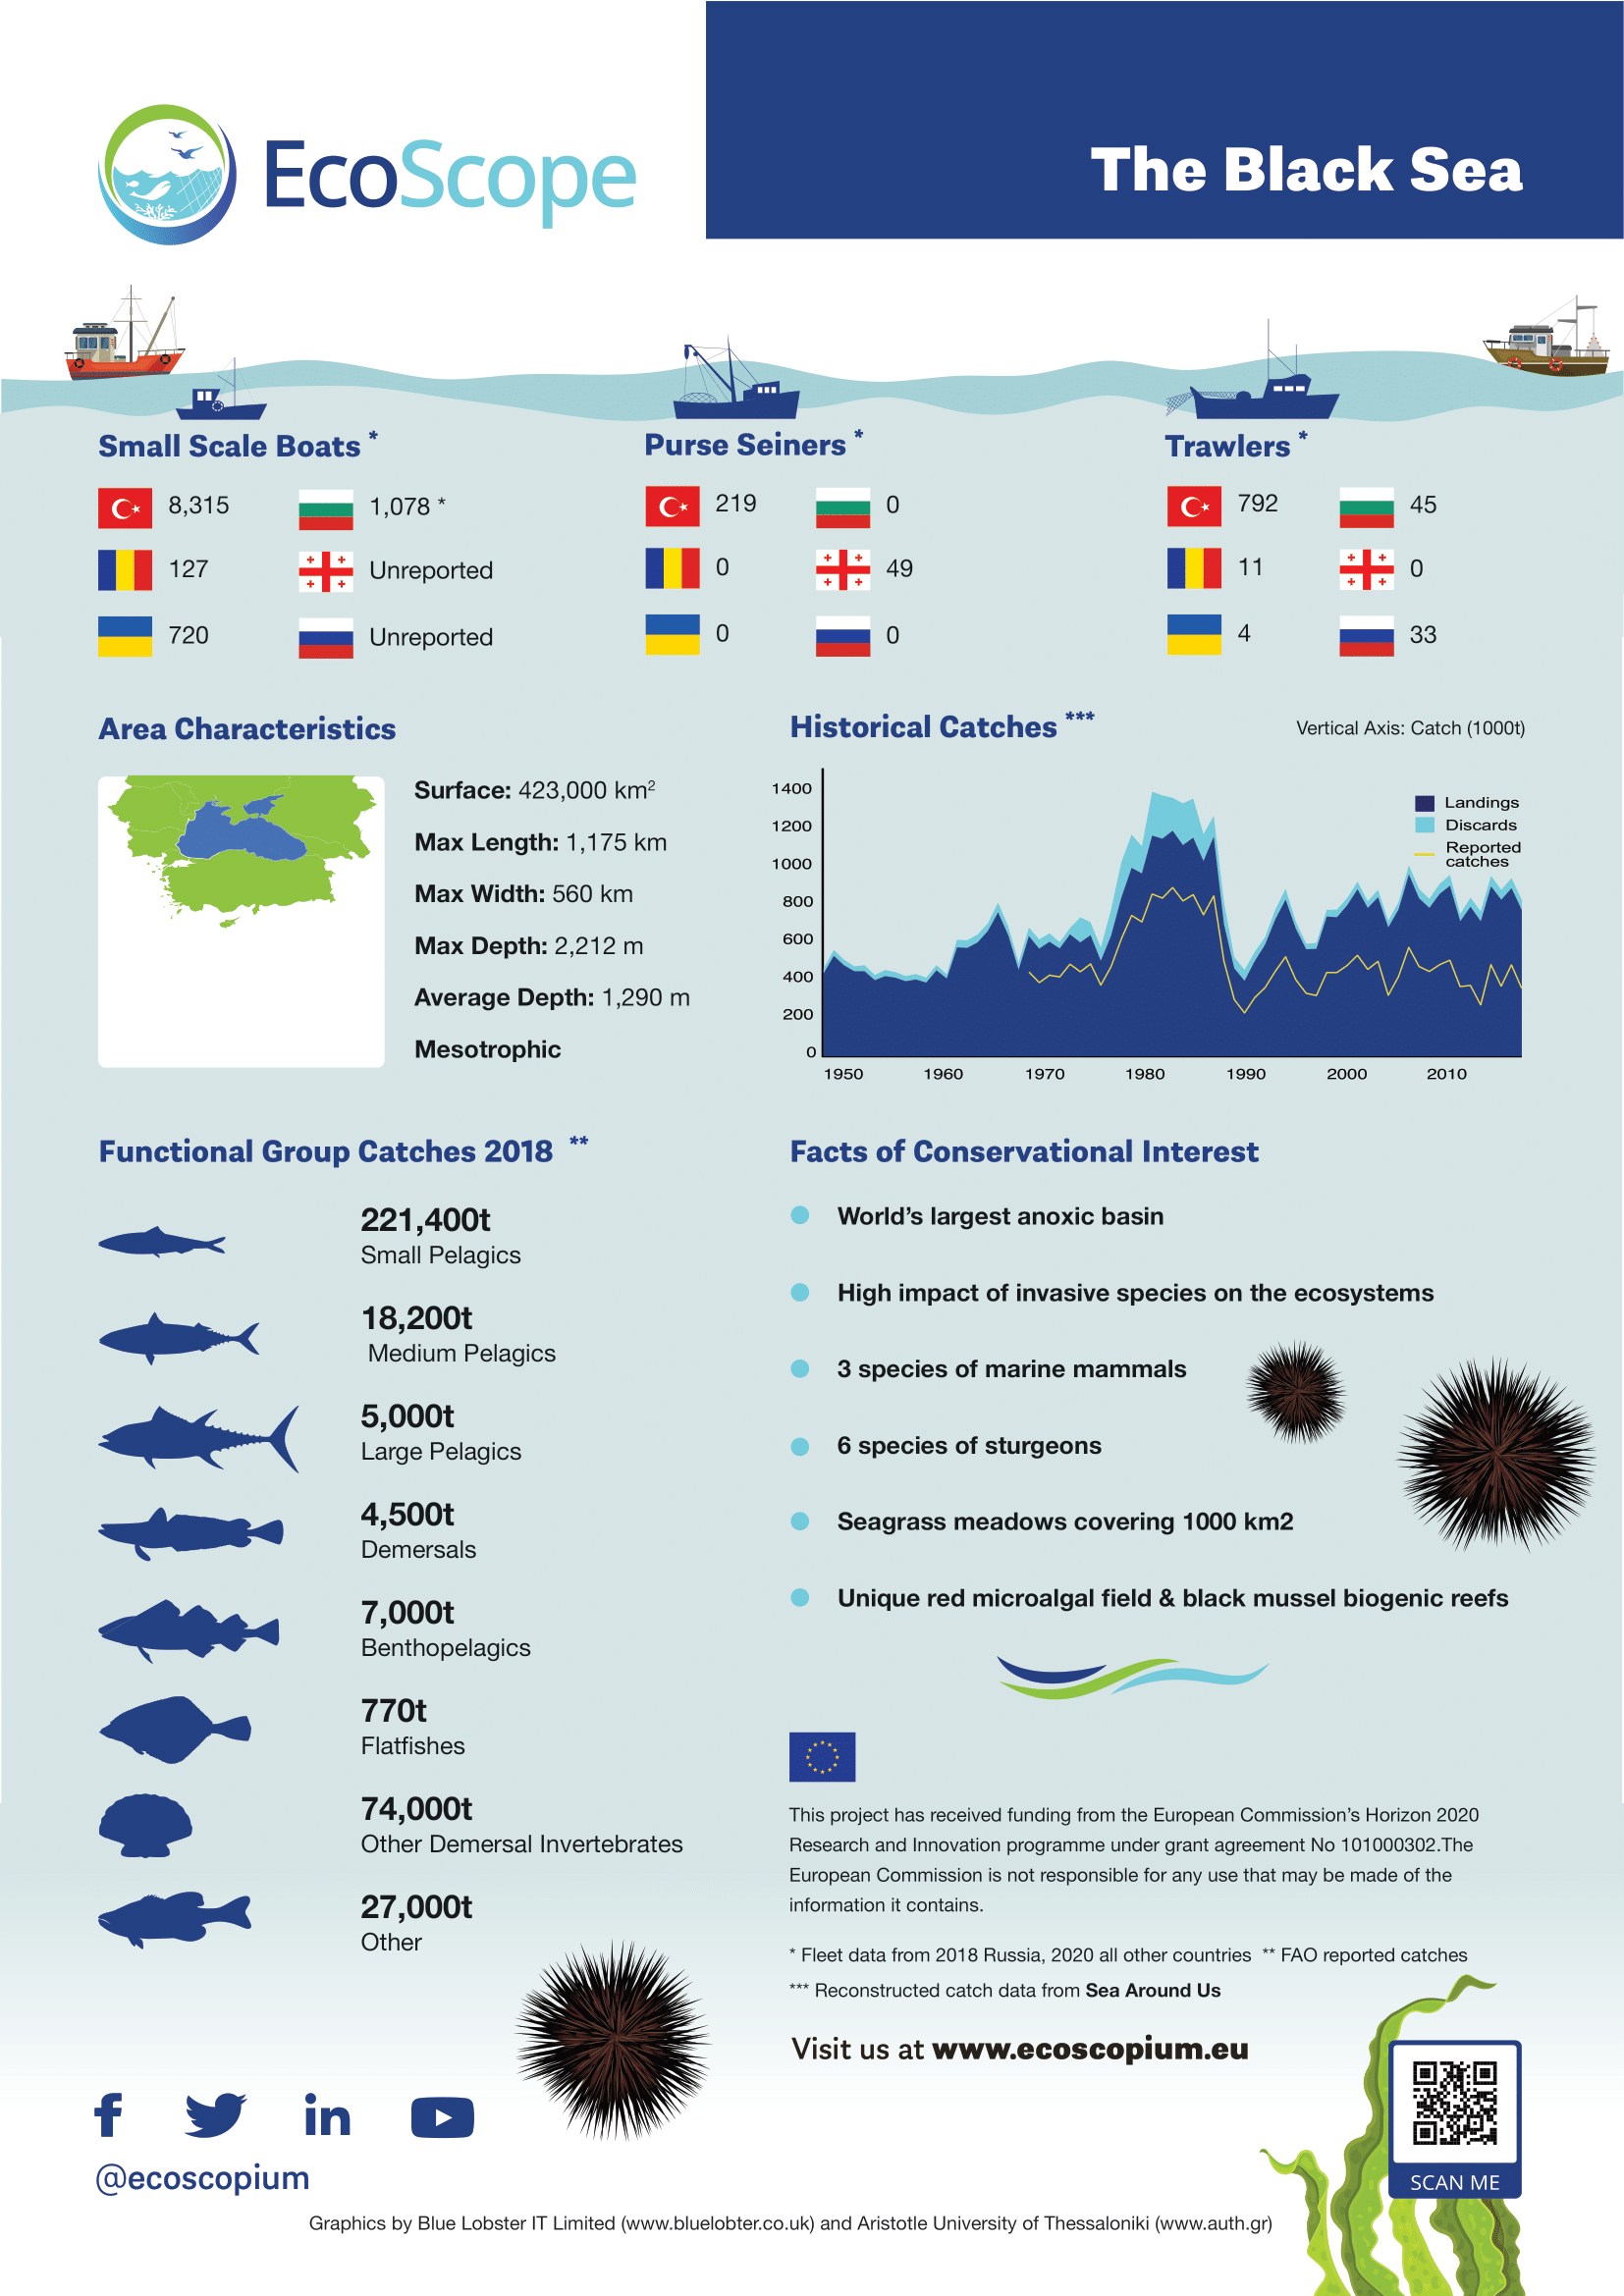
Ecoscope Toolbox

Black Sea

Fisheries Sustainability Scoring Index

yearCatchF.FmsyB.BmsymTLcFiBFSIRytherFogartyFriedlandResIndexMTCPercent_Direct_Human_ConsumptionPercent_NeiPercent_assessed_biomass
1970344613.3802.060.1210.66617.910.8150.2180.774
1971342233.35-0.031.970.1210.66217.840.8240.2260.779
1972414463.340.051.770.1460.65217.930.8260.2120.777
1973463213.310.061.520.1630.63817.920.8360.2270.766
1974424033.320.041.660.1490.63417.930.8090.210.789
1975483783.280.051.390.170.63318.10.8710.2320.753
1976572733.280.131.230.2020.62418.250.8580.2140.772
1977553743.310.151.40.1950.63118.240.8490.2170.763
1978629323.320.211.310.2220.61718.290.820.2080.778
1979705963.250.190.920.2490.6118.040.8280.1850.808
1980727793.270.220.990.2560.61518.210.8280.2040.778
1981691713.280.211.060.2440.61518.290.8280.2120.763
1982774160.6791.3653.250.220.860.2730.62218.440.8330.1350.827
1983772010.7141.3953.240.210.830.2720.61518.540.8080.150.813
1984761500.6421.3923.230.190.790.2680.60518.620.8050.1430.814
1985959570.6821.3413.260.330.730.3380.60418.650.7820.1240.833
19861017570.7751.3083.20.290.410.3580.60418.680.8090.1370.815
19871093380.7951.2753.10.22-0.070.3850.60618.660.8110.1420.82
19881100920.8221.2073.020.14-0.390.3880.60618.730.8060.1680.779
19891250100.9421.1422.910.09-0.930.440.60618.50.7990.1610.797
19901083090.9421.083.040.14-0.280.3810.59618.670.8260.1940.759
19911297641.0761.0642.960.14-0.770.4570.61718.530.7860.2070.755
19921502491.3071.0093.010.26-0.670.5290.60618.280.7840.1750.792
19931609801.3650.9283.130.41-0.290.5670.59718.640.7840.1430.823
19941772061.5280.843.250.580.120.6240.61218.750.7790.1440.819
19951478711.6030.7992.970.22-0.870.5210.59818.460.770.1550.81
19961383191.5340.7012.90.12-1.080.4870.60418.590.8050.170.777
19971461211.4990.6552.66-0.09-2.10.5150.60618.440.790.180.77
19981274401.3660.6943.020.21-0.540.4490.618.30.80.1740.788
19991066461.2020.6562.69-0.2-1.710.37612128880.5918.550.7870.2240.713
2000885001.1840.6383.120.150.180.31210514100.59718.440.8240.2280.733
2001844021.1340.6453.070.080.040.29710841510.60718.810.830.2410.724
2002871011.090.6182.970-0.380.30710605540.60818.930.8270.1910.774
2003819941.2240.6152.89-0.11-0.650.2898892810.60319.010.8320.2160.755
2004897951.3260.6462.91-0.05-0.660.3169723870.6119.140.8210.210.761
2005920751.410.6523.010.07-0.270.32410242360.60218.920.8120.1930.766
20061098931.5390.6612.78-0.09-1.350.3871104413810950.59619.010.7860.150.815
20071078771.5380.6333.010.13-0.430.381217036793750.618.840.790.1320.838
2008900771.5860.6193.040.08-0.140.3171009280687960.60518.910.7970.1350.827
20091002341.5450.63.060.15-0.140.3531159017782700.60218.850.7750.1140.847
2010822371.5830.56330.01-0.220.29859193599080.60419.060.7750.1460.814
2011711941.4880.5352.98-0.08-0.190.251779121553500.606190.7470.1360.836
2012714921.3120.5393.02-0.04-0.020.252867383552080.60518.890.7520.1470.825
2013710211.210.5263.01-0.05-0.050.25844618571680.60318.930.7720.1350.831
2014743061.130.5342.97-0.08-0.280.262951657616220.61418.930.7990.1230.836
2015808921.0290.5212.92-0.09-0.530.285835645585800.611190.7980.110.851
2016878440.9050.5152.81-0.16-1.070.3091067692707210.62519.170.7950.1080.823
20171020890.8180.5152.88-0.03-0.920.361212991800470.62118.930.780.1070.837
2018974670.860.5612.84-0.08-1.010.3431099116723080.623190.7640.0920.85
20191009350.890.6222.84-0.07-1.050.3551107659744560.62719.220.7870.0940.858
2020922330.7930.6642.8-0.15-1.140.3251069026753740.6319.240.0890.857

Individual indicators

Fishing pressure (F/Fmsy)

The current fishing mortality or fishing pressure (F) over the fishing mortality or fishing pressure (FMSY) that, if applied over a time span similar to generation time, will eventually result in a catch equal to MSY.

Stock status (B/Bmsy)

The current biomass/stock size (B) over the smallest stock size that can support catches equal to MSY (BMSY). It is an output of stock assessment models and ideally, in ecosystem perspective, it should include a large proportion of the exploited species.

Mean Weighted Trophic Level of the Catch (mTLc)

The mean weighted trophic level of the catch (mTLc) is calculated based on the trophic level of species weighted by the catch/landings of each species contributing to the total catch. It is used to assess the effect of fisheries on marine communities and ecosystems.

Fishing in Balance index (FiB)

The Fishing in Balance index (FiB), which complements the mTLc, is an indicator of exploitation and geographic/bathymetric expansion or contraction of fisheries.

Fishing Sustainability Index (FSI)

Fishing Sustainability Index (FSI) uses a factor to correct the magnitude of difference of mTLc and FiB to the first year of the time series and expresses this difference in standard deviation units so that the ordinate scale indicates change without reference to absolute trophic levels.

Ryther Index (Ryther Index)

Ryther index expresses the catch/landings per area (in km2).

Fogarty Index (Fogarty Index)

Fogarty index expresses the catch/landings per unit of primary production.

Friedland Index (Friedland Index)

Friedland index expresses the catch/landings per unit of chl-a.

Resilience Index (Res Index)

The Resilience Index (Res Index) is calculated based on the maximum intrinsic population increase (resilience) of species weighted by the catch/landings of each species contributing to the total catch. It is used to assess the effect of fisheries on marine communities and ecosystems.

Mean Temperature of the Catch (MTC)

The mean temperature of the catch (MTC) is an index that is used for the evaluation of the effect of sea warming on marine fisheries based on the preferred temperature range of the species participating in the catch/landings.

Catch/Landings

Total catch or landings per area/fleet which gives historical information on the fisheries and is used in as a preliminary assessment in fisheries management and as input in ecosystem models.

Scroll to Top